Case Study: US Permian Region
Sand Management Using Rocsole SoliDetect 1.0
A world-leading IoT service company provides technical service and on-site services for a global integrated Oil & Gas Company.
The customer, in cooperation with tech partner Rocsole, tested and validated the performance for the ability of providing insights to sand and solids accumulation in the process vessel.
Here the SoliDetect 1.0 product was applied. The unique data is generated through the proprietary 32 electrode sensor inserted via an existing bottom nozzle in the Facility Test Separator.
12/2021
Start monitoring
28/03/2022
4” of sand in the vessel
29/03/2022
Controlled maintenance / jetting process
30/03/2022
Vessel clean of sand again, ongoing monitoring
Sand Management: Existing Solutions Are Unreliable
Currently, the standard technology used for the identification of sand within vessels is ”Tuning Forks”. These detectors produce a signal when sand particles impact them. The amplitude of the signal is proportional to the amount of sand.
Other methods used include acoustic sensors (clamp-on meters), erosion probes, coupons, or thermographic analysis.
However, all of these have significant drawbacks and limitations.
The challenges with the previously utilized sand detection equipment are:

No clarity
The signal / response does not indicate if the sand is being deposited within
the vessel.
Different grain, different signal
The signal amplitude is impacted by the velocity/force of the impact. The particle size of the sand will also affect the recorded signal.

double up
To overcome the issues with “signal loss”, customers are installing multiple sensors per location.

need contact
The “tuning forks” are only small sensors and will only detect sand contacting the sensor.

Coating reduces signal
If the sensors become coated, (wax, scale, etc.) this will reduce the signal intensity, or if totally fouled, no signal will be recorded.

Plates need replacement
The impact of sand
will also cause erosion
of the plates.
The Critical Goals

Integrate the sand accumulation data with the sand removal program

Prevent unwanted shutdowns
and the potential for corrosion / solids build-up.
Meet the team to tackle the challenge
All success is based on great teamwork and in this case we’d like to thank our client's team for the great cooperation. Please meet the Rocsole project team involved:
let's check twice
Validation done successfully with clear before / after result
The Split Test Setup
SoliDetect 1.0 was tested and commissioned at the piloting location in Q4/2021.
The objective was to monitor the amount of sand accumulating at the bottom of the vessel.
CASE A
Tested in a place where the sand was improbable
At the beginning of the testing period, sand accumulation was minimal/negligible due to the sand removal equipment installed in front of the test vessel.
The Rocsole SoliDetect 1.0 system saw NO presence of sand in the vessel. The customer executed a thermal imaging scan and vessel inspection after being reported by the Rocsole system.
Both gave the same results: NO recognition of sand in the vessel.
CASE B
Tested in a place where the sand was highly probable
The sand removal equipment was removed from the process. From then on, sand was expected to accumulate at the bottom.
On 28 March 2022, Rocsole SoliDetect 1.0 system received a signal of approximately 4″ sand in the bottom of the vessel.
The customer team conducted another thermal imaging which indicated that there might be 8 – 10″ sand in the vessel. We could see here again how thermal imaging can get it wrong.
Based on the insight, a planned sand jetting process to clean the vessel was successfully run on 29 March.
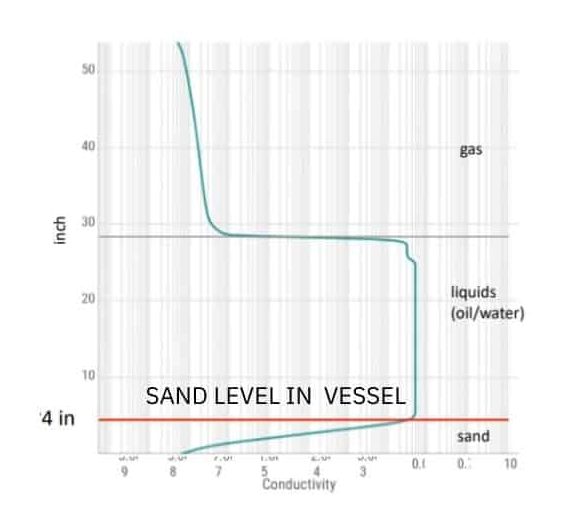
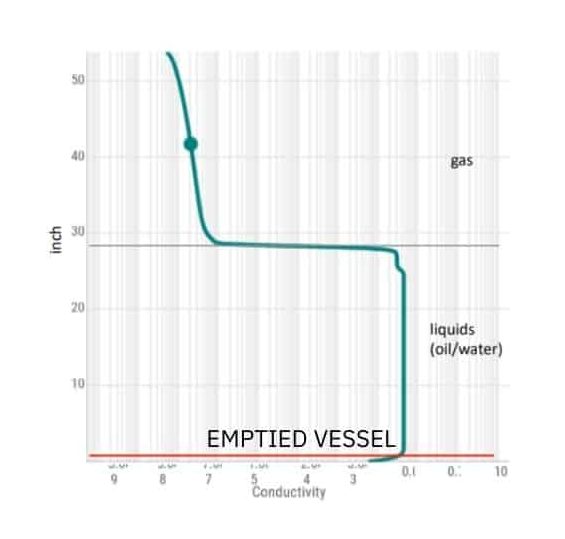
Sand could be detected from the conductivity profiles: Decreased conductivity levels indicate sand

Before
Sand build-up
Before jetting on 29 March at 09:59 am local time, the conductivity profile indicated lower conductivity in the bottom of the vessel.
This effect was interpreted to be caused by sand. The sand level at this time was indicated by the ‘shoulder’ at 4”.

after
Emptied vessel
During jetting (here at 10:48 am), the conductivity profile had changed in the lowest part of the separator.
The ‘shoulder’ could be seen in the lower level, with higher conductivity at the bottom. The change was due to suspended and/or removed sand.
For the different levels of detected sand, it was mutually explained and agreed that the used thermal imaging method might only collect signals closest to the walls of the vessel while sand typically accumulated unevenly in the separator.
After the two testing situations, Rocsole SoliDetect 1.0 was validated by the customer for the #SeeBeyond technology to detect sand in the process.
The Benefits of an Electrical Tomography In Situ Sand Management Solution
There are a number of technologies able to measure the presence of sand, however, volume and as well as an exact area for deposition are harder to determine.
By understanding the mechanics of sand deposition and
volume it is possible to:
1.
Control Solid Removal
Operations (automatically
or manually)
2.
Prevent vessels from
being clogged with solids.
3.
Reduce the potential for under deposit corrosion.
4.
Maximise separation capacity of vessels
(Oil/Gas, Water quality).
5.
Optimise Chemical Treatment.
6.
Prevent solids from carrying over.
The Details in Overview
System Design:
- Operating Pressure 1000 psi (68 Bar)
- Design Pressure 1440 psi (100 Bar)
- System Operating Temperature 120F (49C)
- Design Temperature 200F (94C)
- 1 x 32 Electrode G3 sensor (875 mm in total length)
- User Interface webroc 1.0

Delivery Content:
The installed package contained the Rocsole sand management system “SoliDetect 1.0” – here consisting of:
- 32 electrodes (G3) of measurement area
- IECEx certified
- Sensor material 14404 – 316L
- Cabinet material Aluminium Epoxy
- Vessel bottom installation


